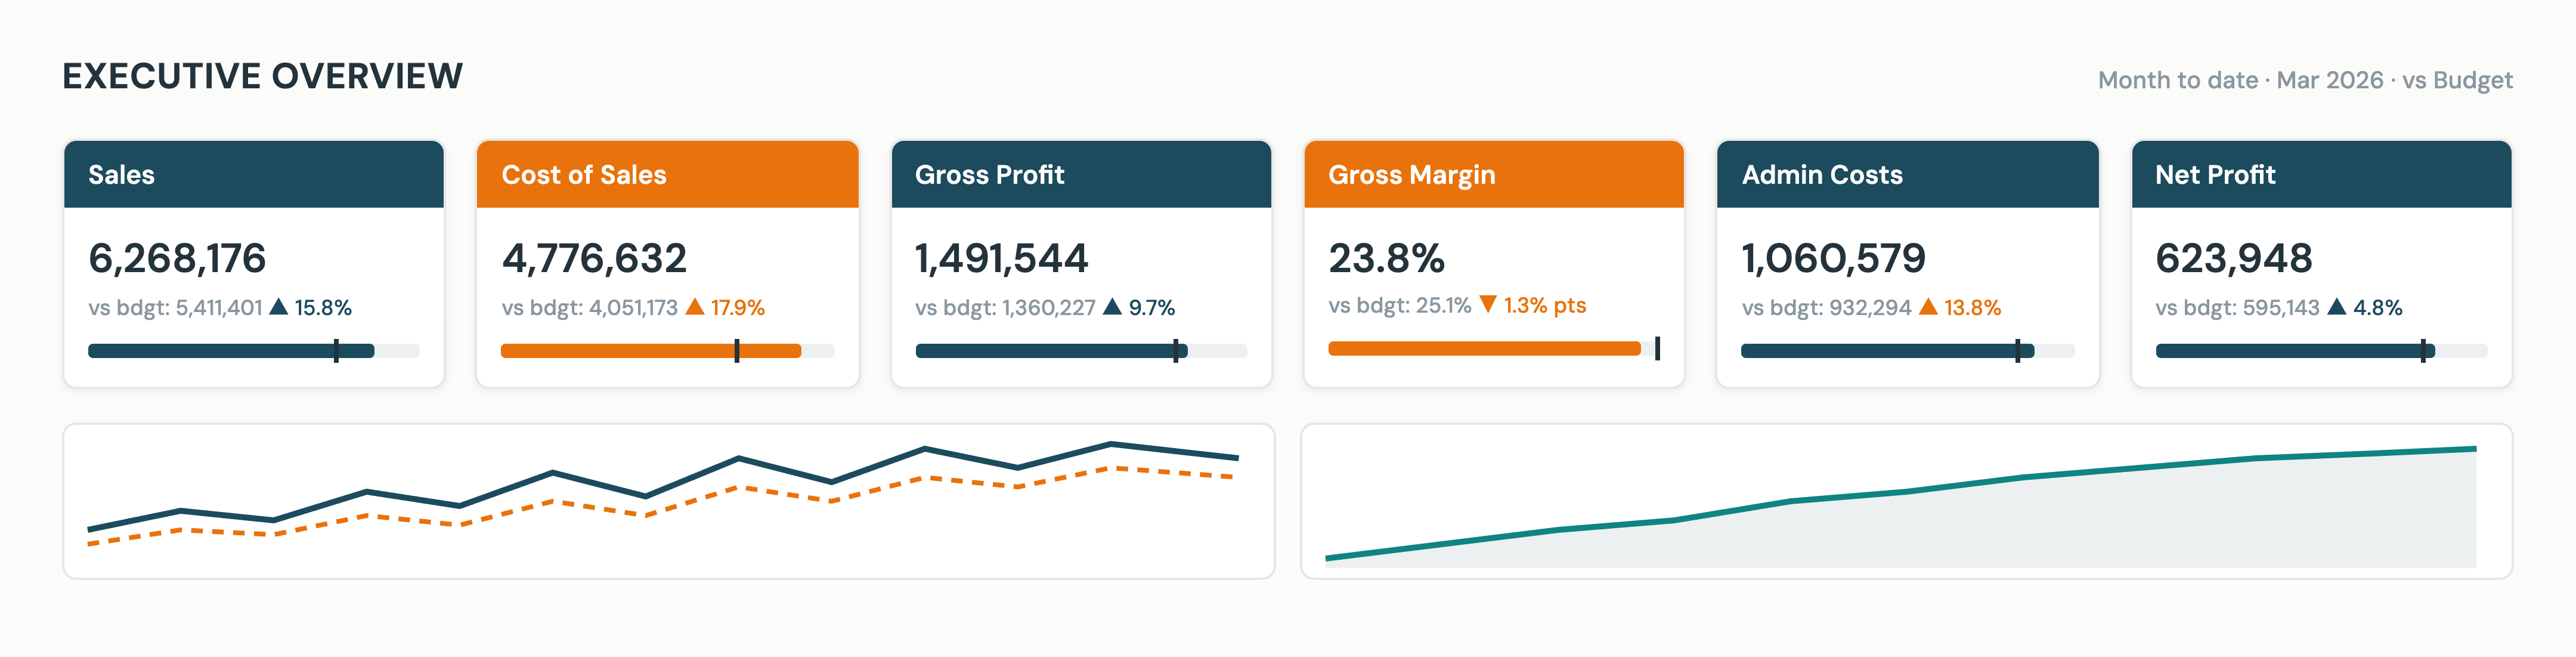
The business at a glance
Executive Overview
Bring sales, margin, cash and working capital together, with the detail to see where performance is moving.
Explore this dashboard on Tableau Public (opens in a new tab) Let’s talk
Explore reporting built around the questions your people need to answer, from daily trading to stock, delivery and financial performance.
Expertise in our team
We bring deep technical expertise and a keen eye for visual storytelling. Working with your people, we turn complex data into clear, thoughtful reports that make the next decision easier.




Open any example to explore it on Tableau Public. Each report brings a different business question into focus.
The business at a glance
Bring sales, margin, cash and working capital together, with the detail to see where performance is moving.
Explore this dashboard on Tableau Public (opens in a new tab)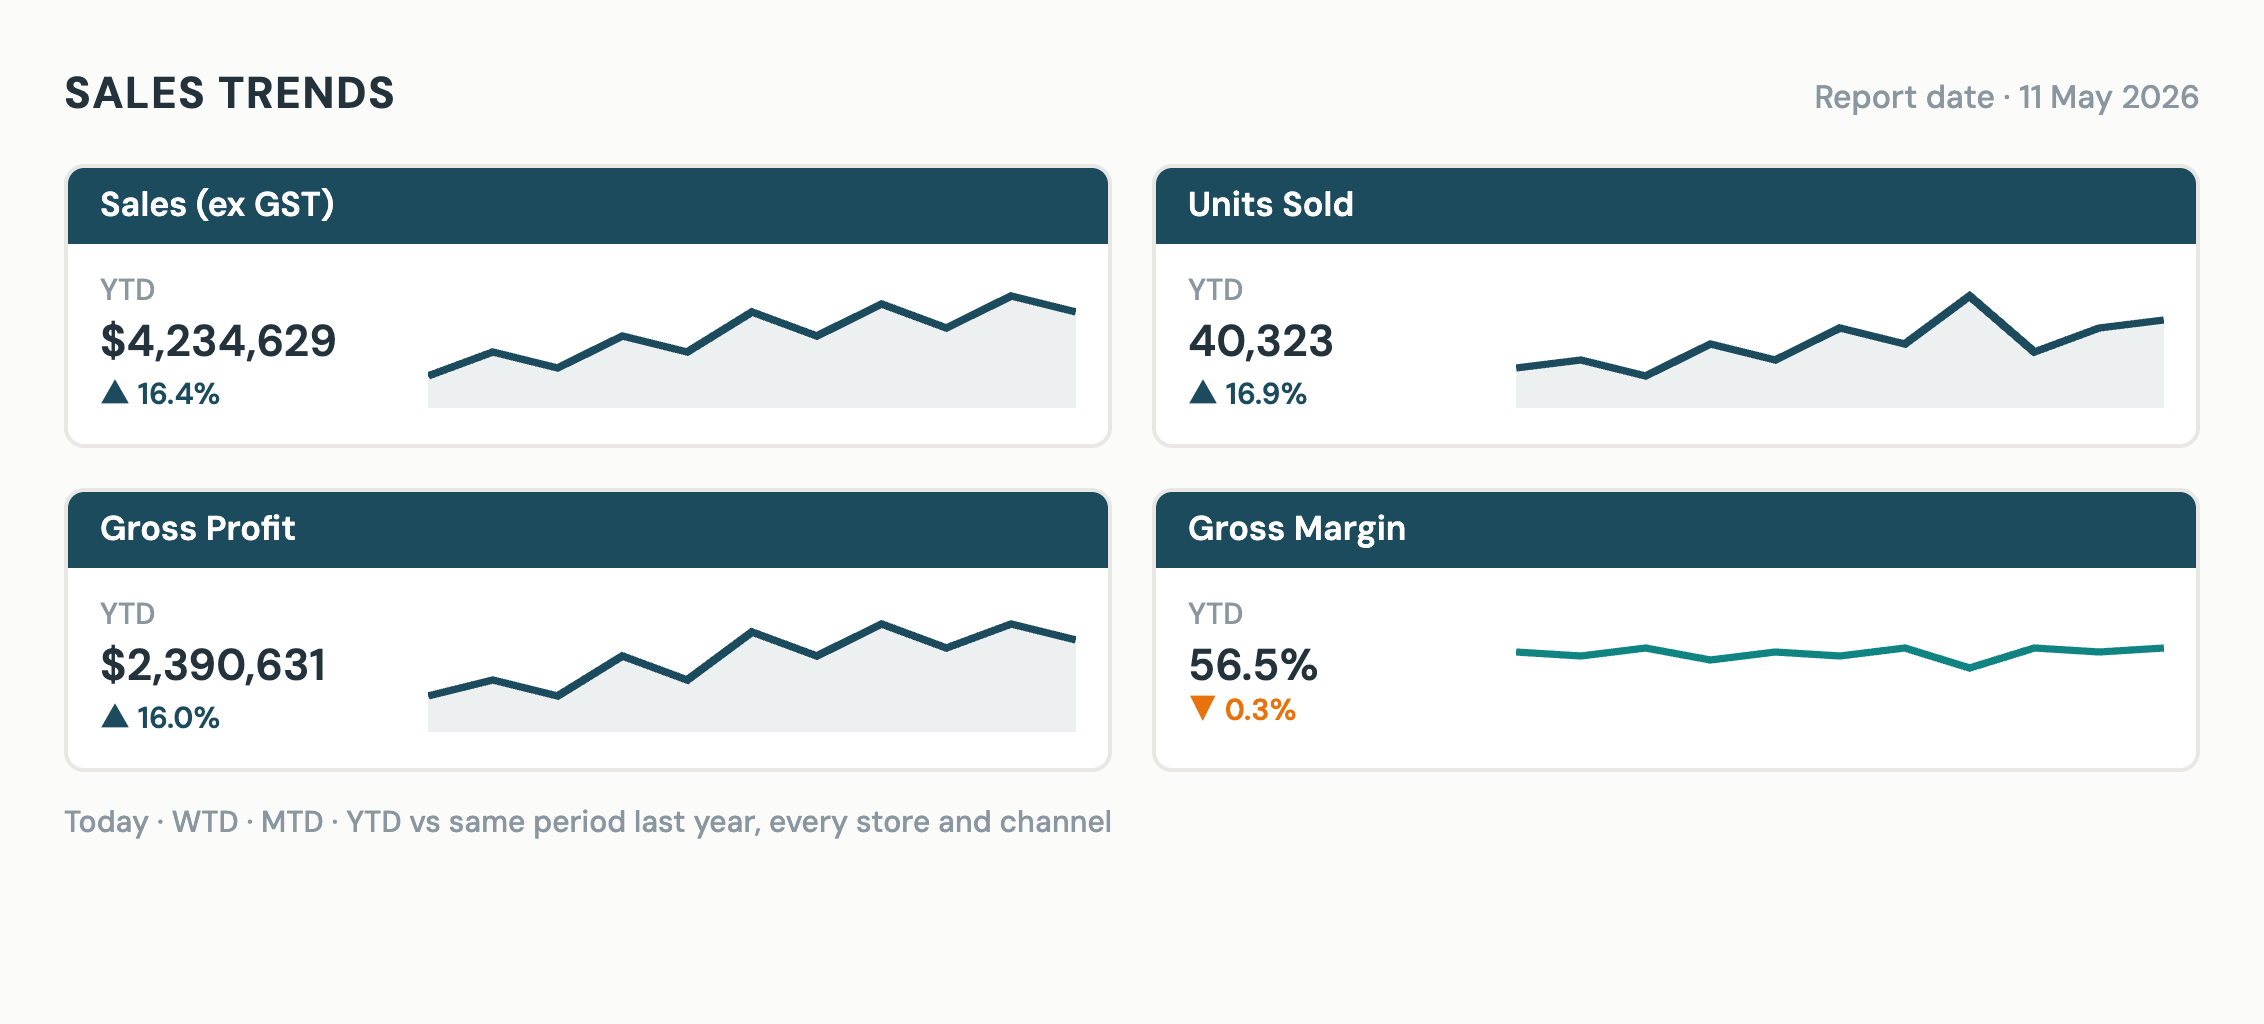
Sales
Follow sales across stores, channels and product lines. Compare trading with last year and see where the change is coming from.
Explore this dashboard on Tableau Public (opens in a new tab)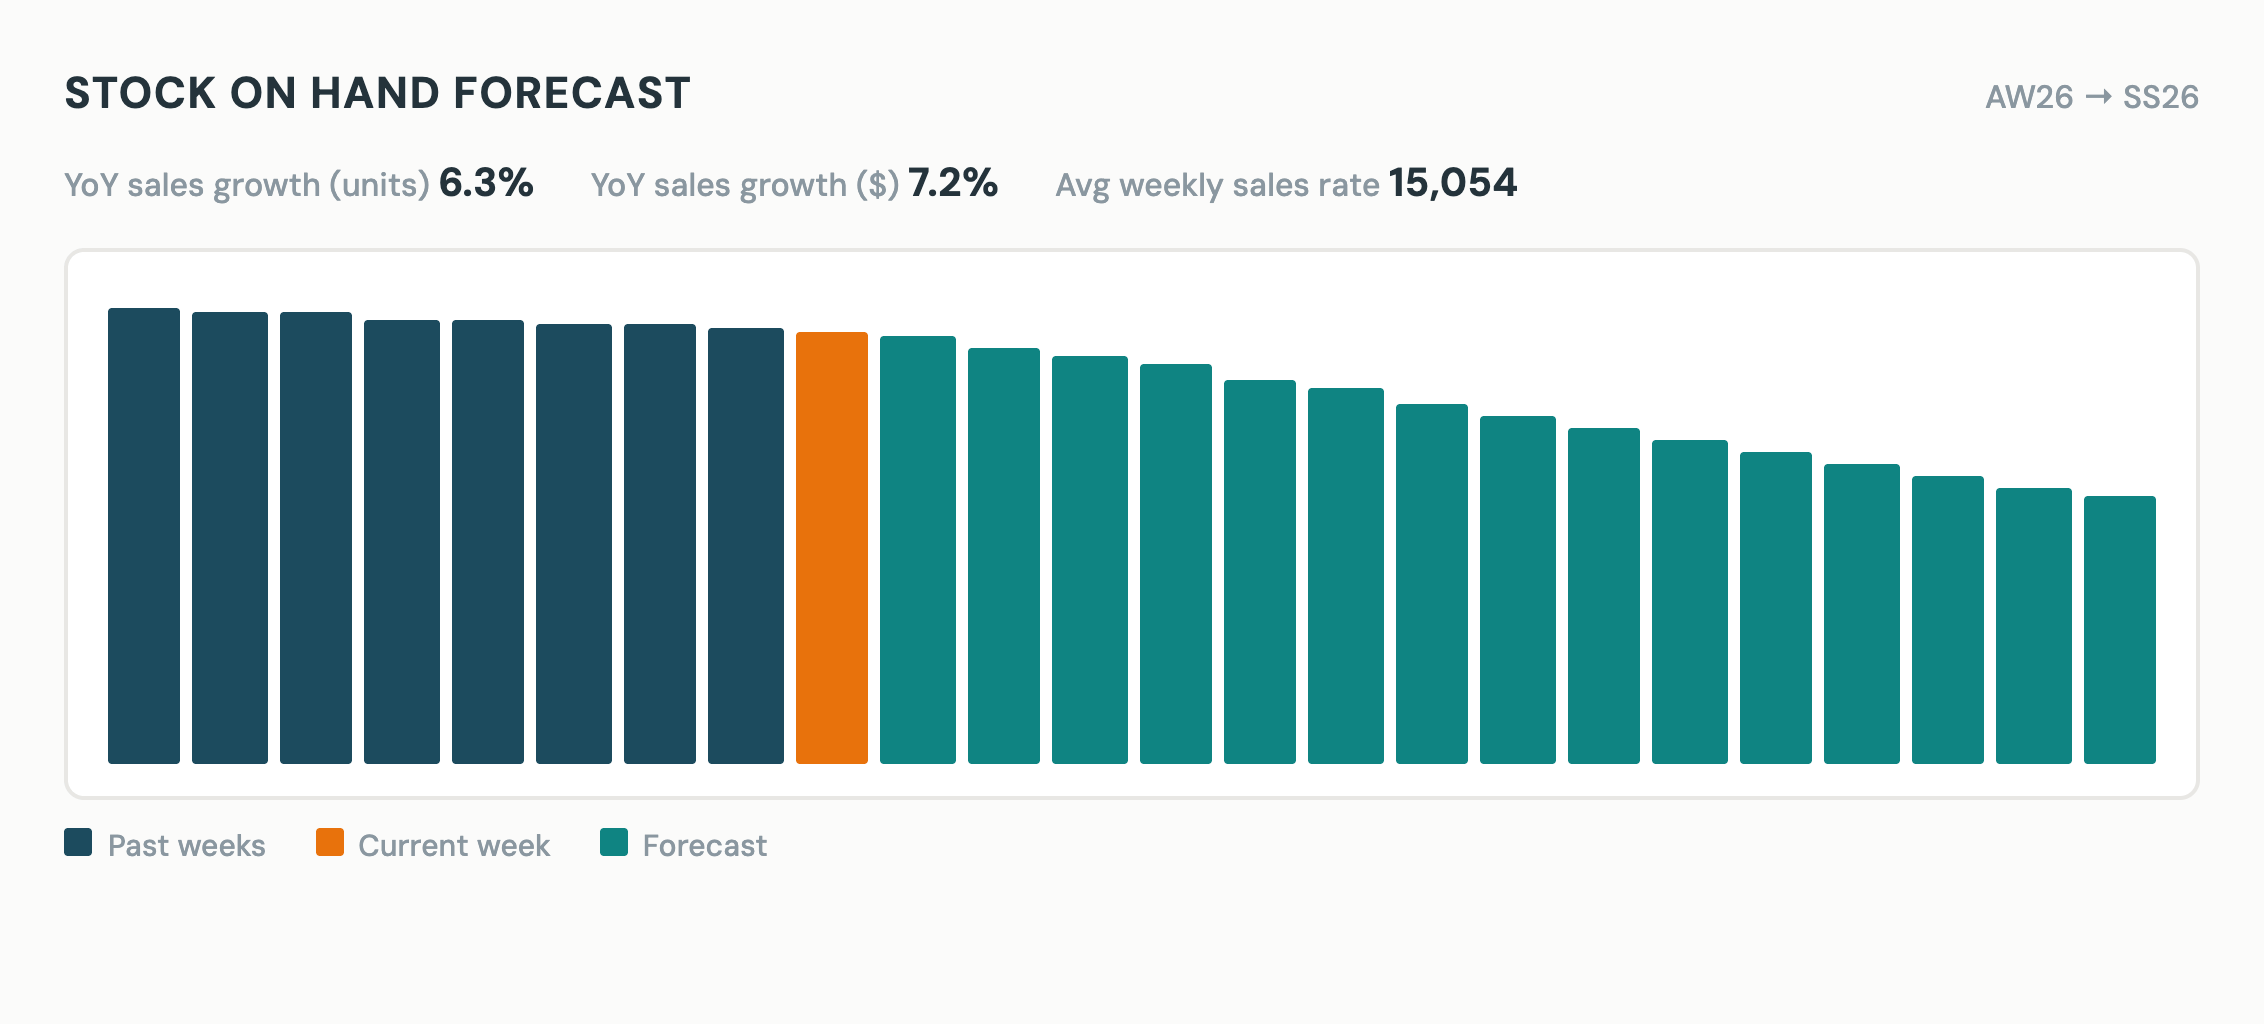
Inventory
See how long stock is likely to last, which lines may run short and where slower sales could leave excess inventory.
Explore this dashboard on Tableau Public (opens in a new tab)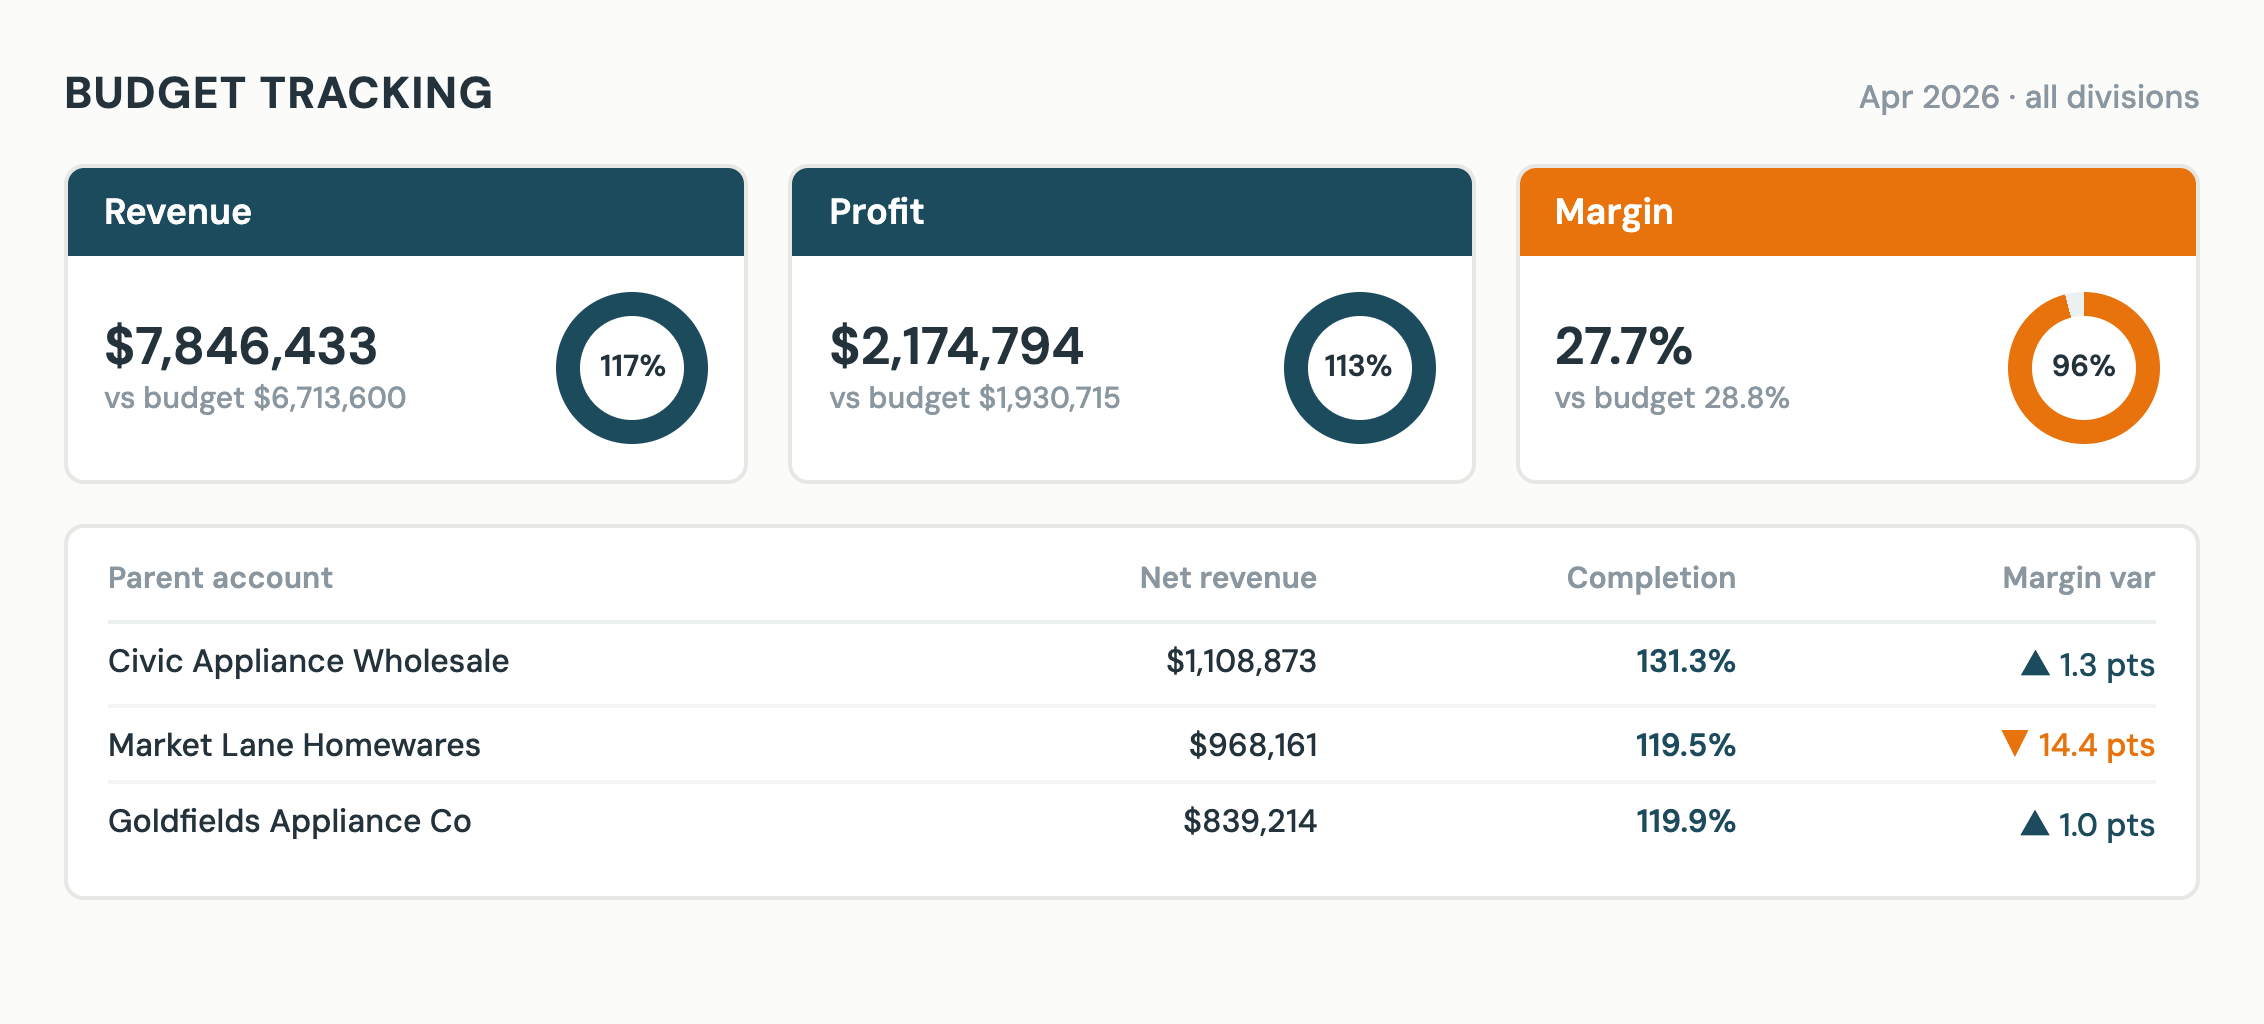
Sales
Track revenue, profit and margin against budget by account, brand and sales manager. Find the gaps that need attention.
Explore this dashboard on Tableau Public (opens in a new tab)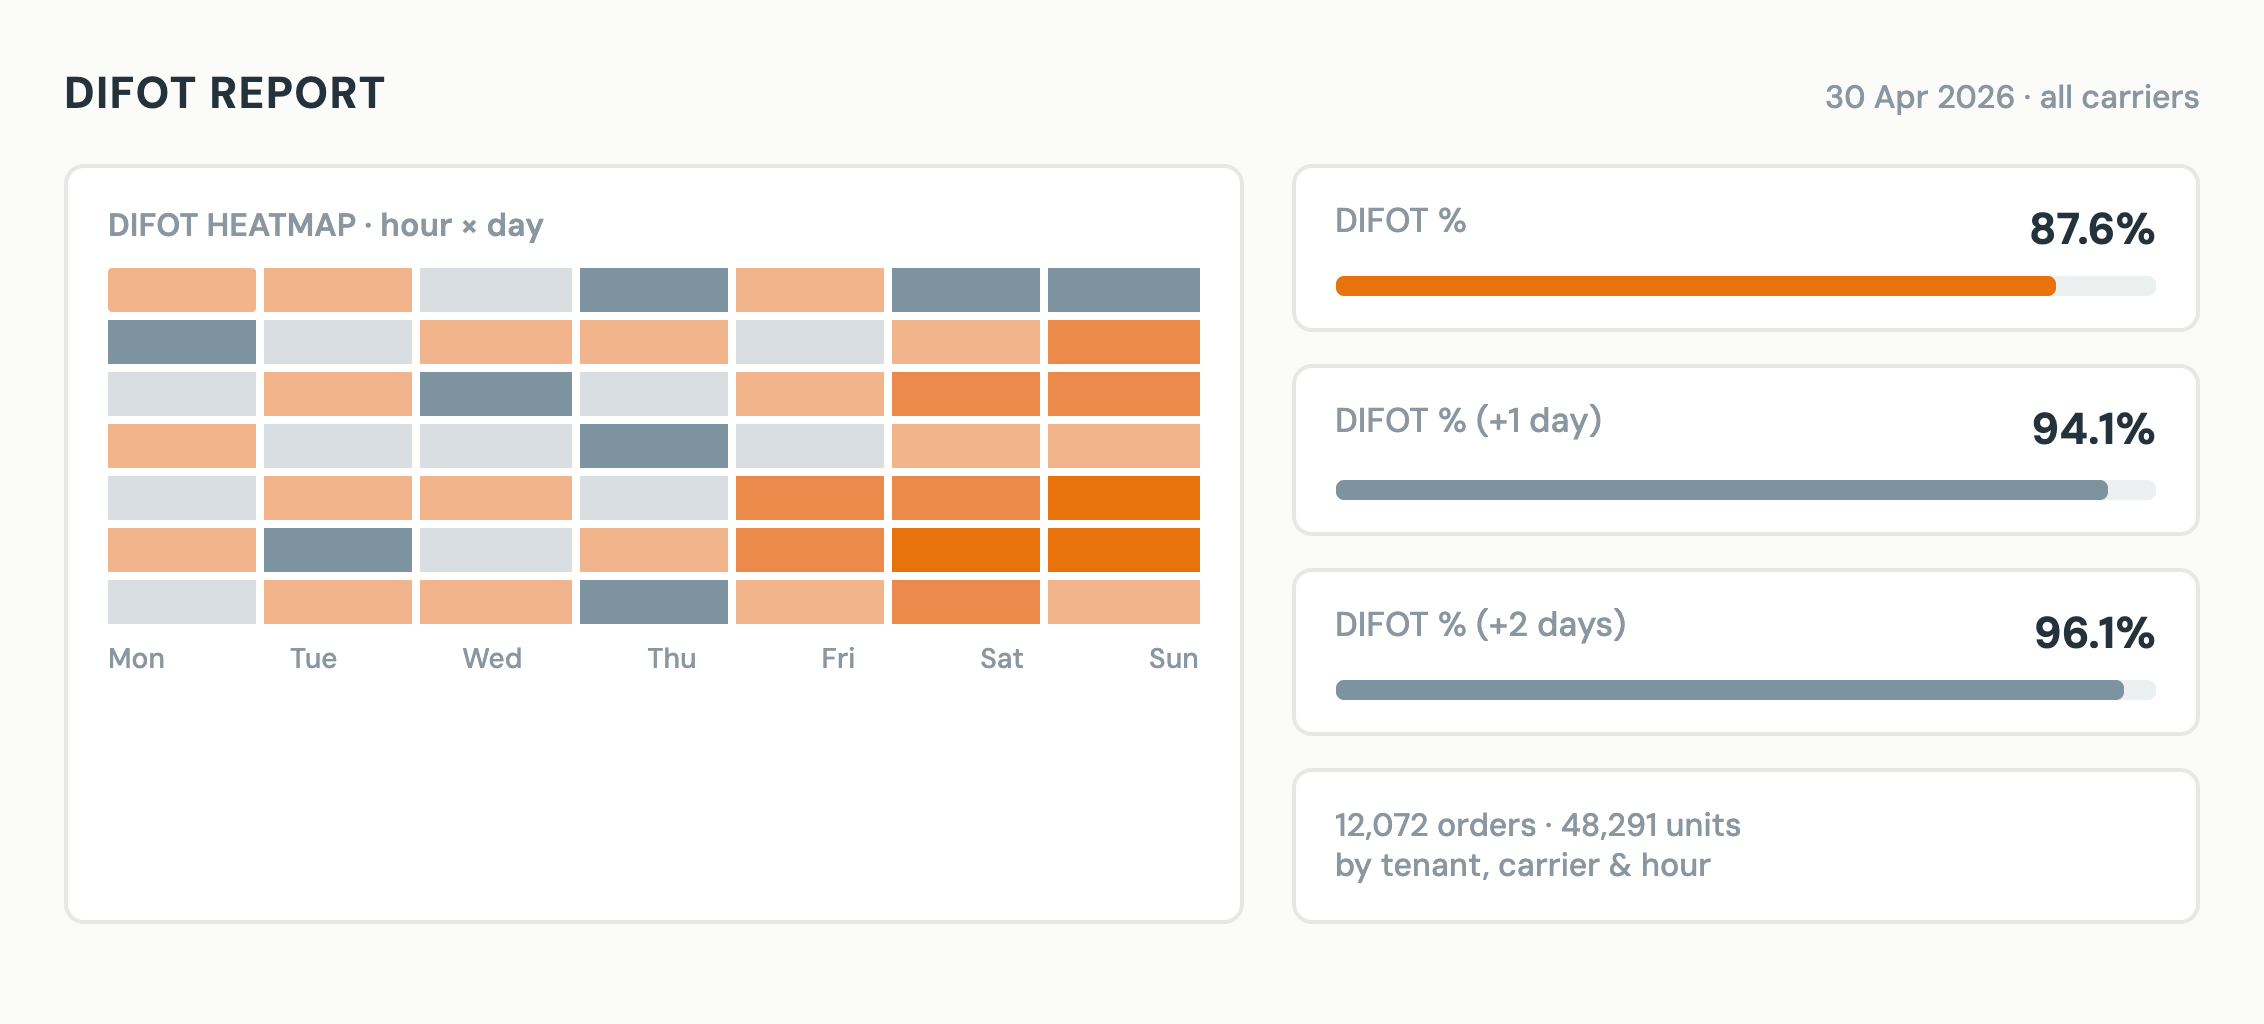
Operations
Understand where deliveries fall short of being in full and on time. Explore the pattern by carrier, tenant, day and hour.
Explore this dashboard on Tableau Public (opens in a new tab)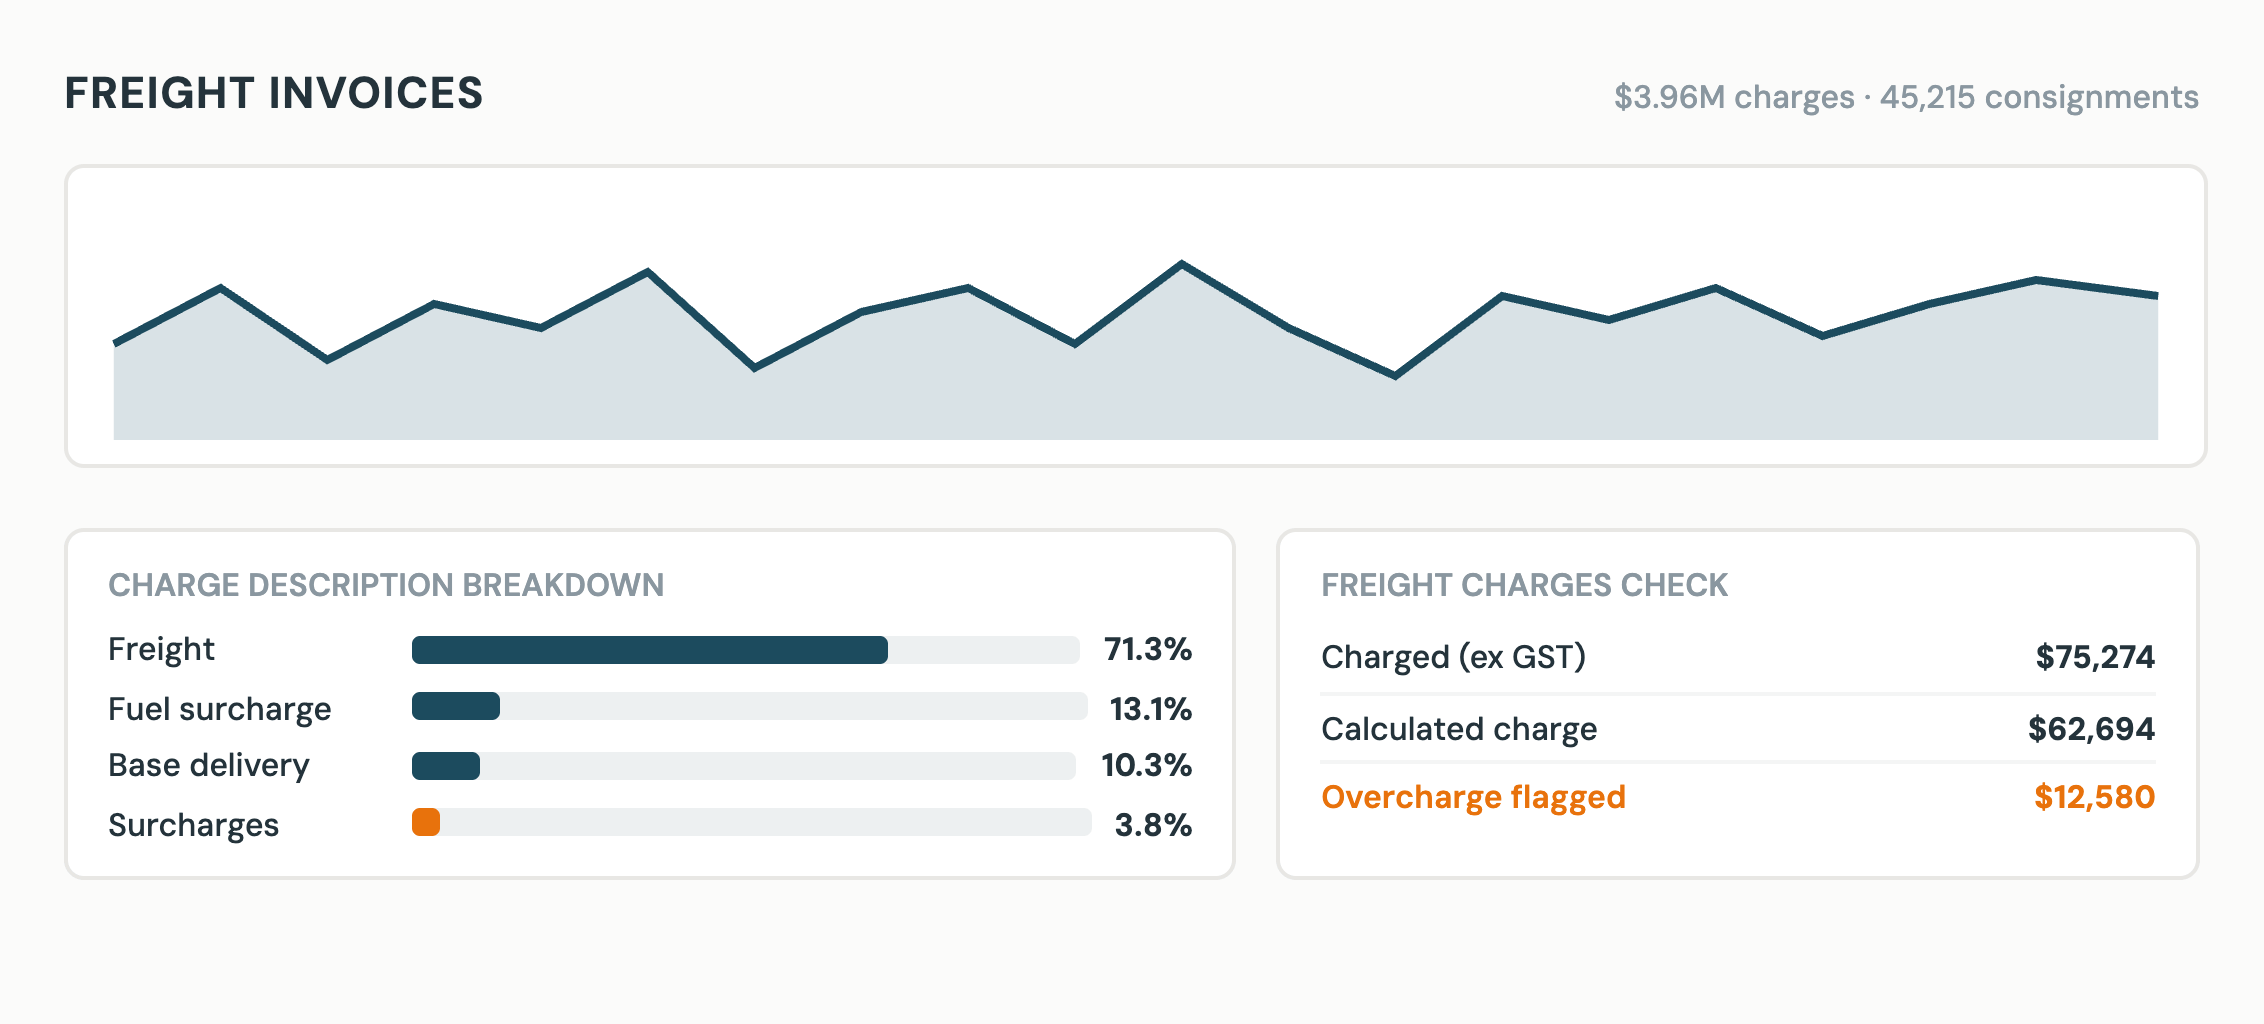
Operations
Compare freight invoices with contracted rates and identify charges that need checking, down to the individual line.
Explore this dashboard on Tableau Public (opens in a new tab)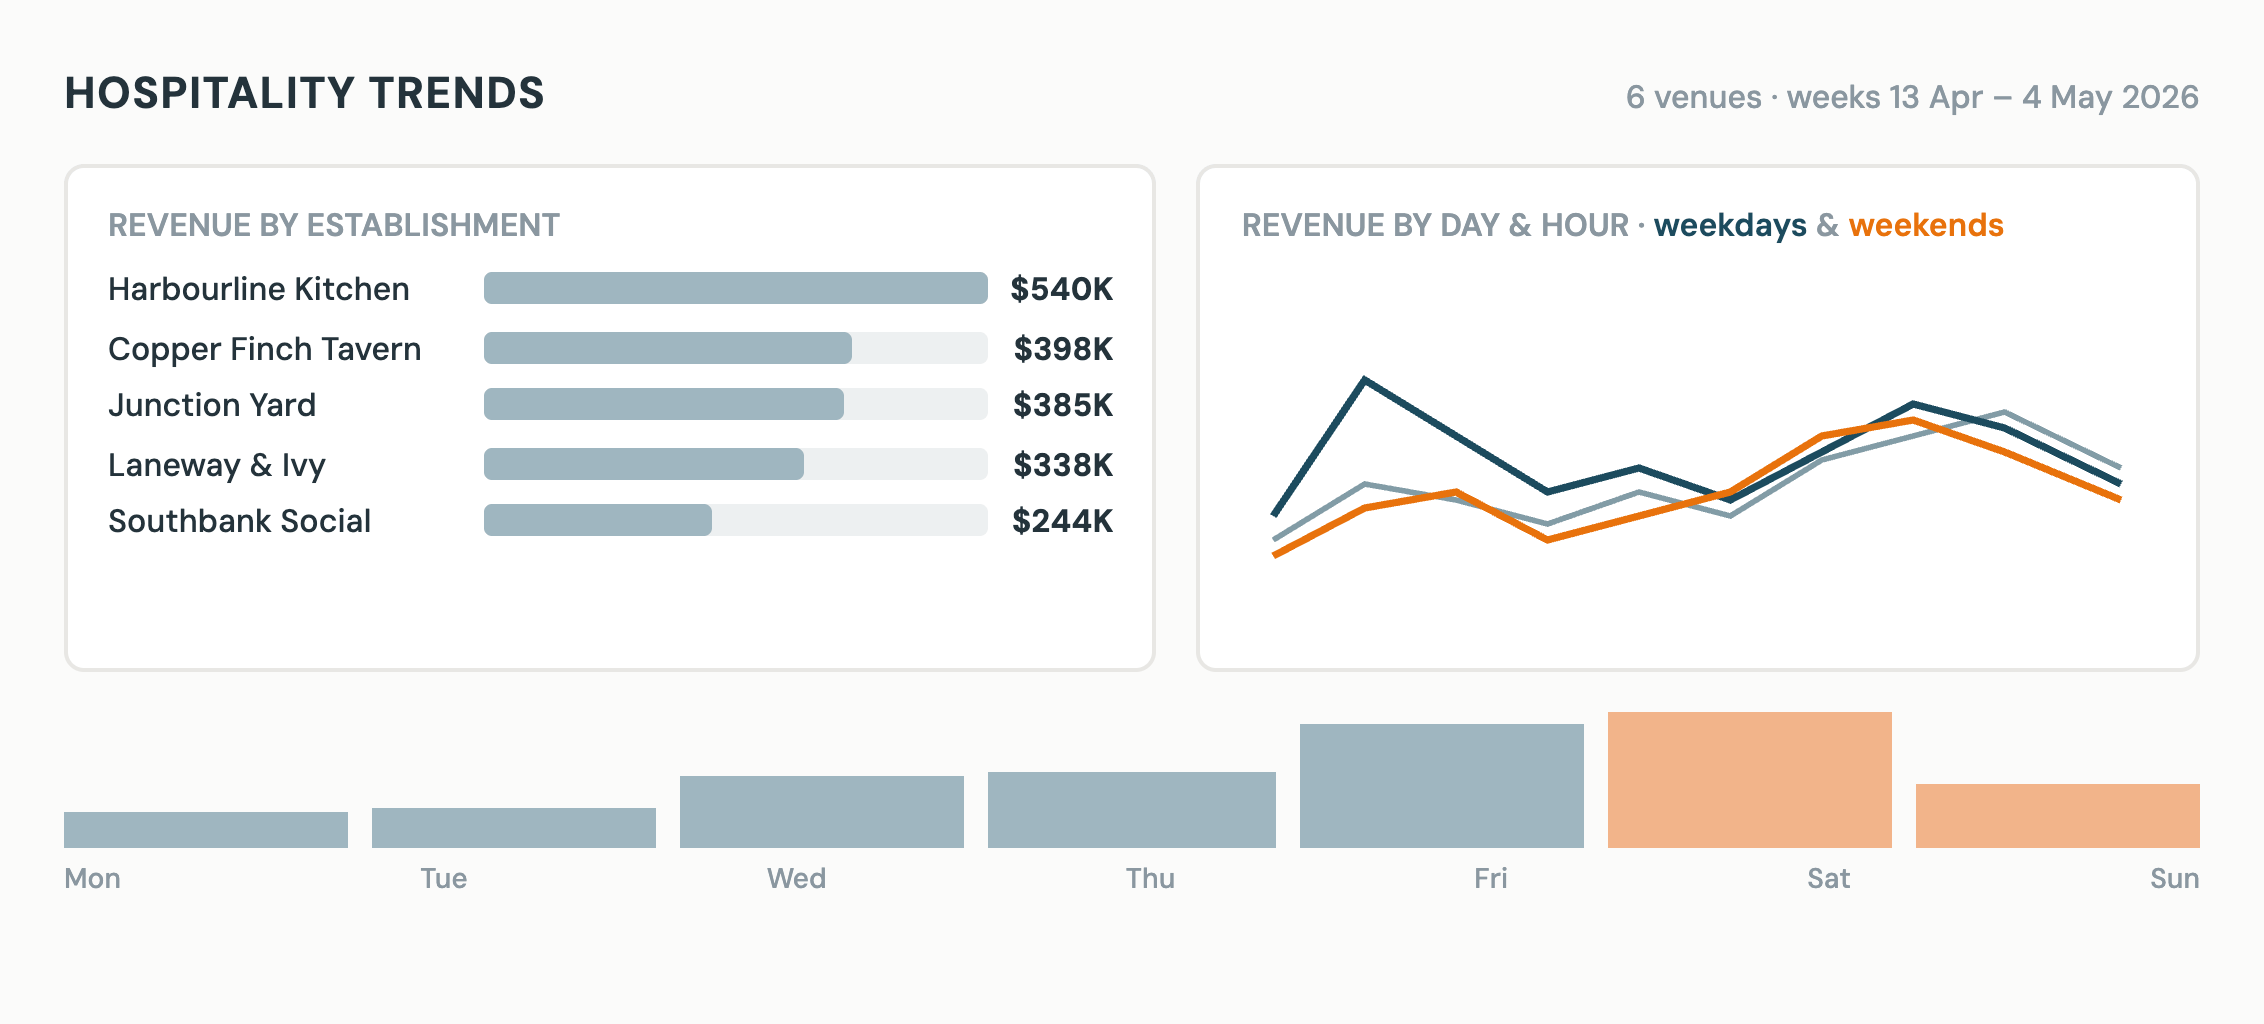
Operations
Explore revenue by venue, day and hour, so staffing and stock decisions reflect the way your venues trade.
Explore this dashboard on Tableau Public (opens in a new tab)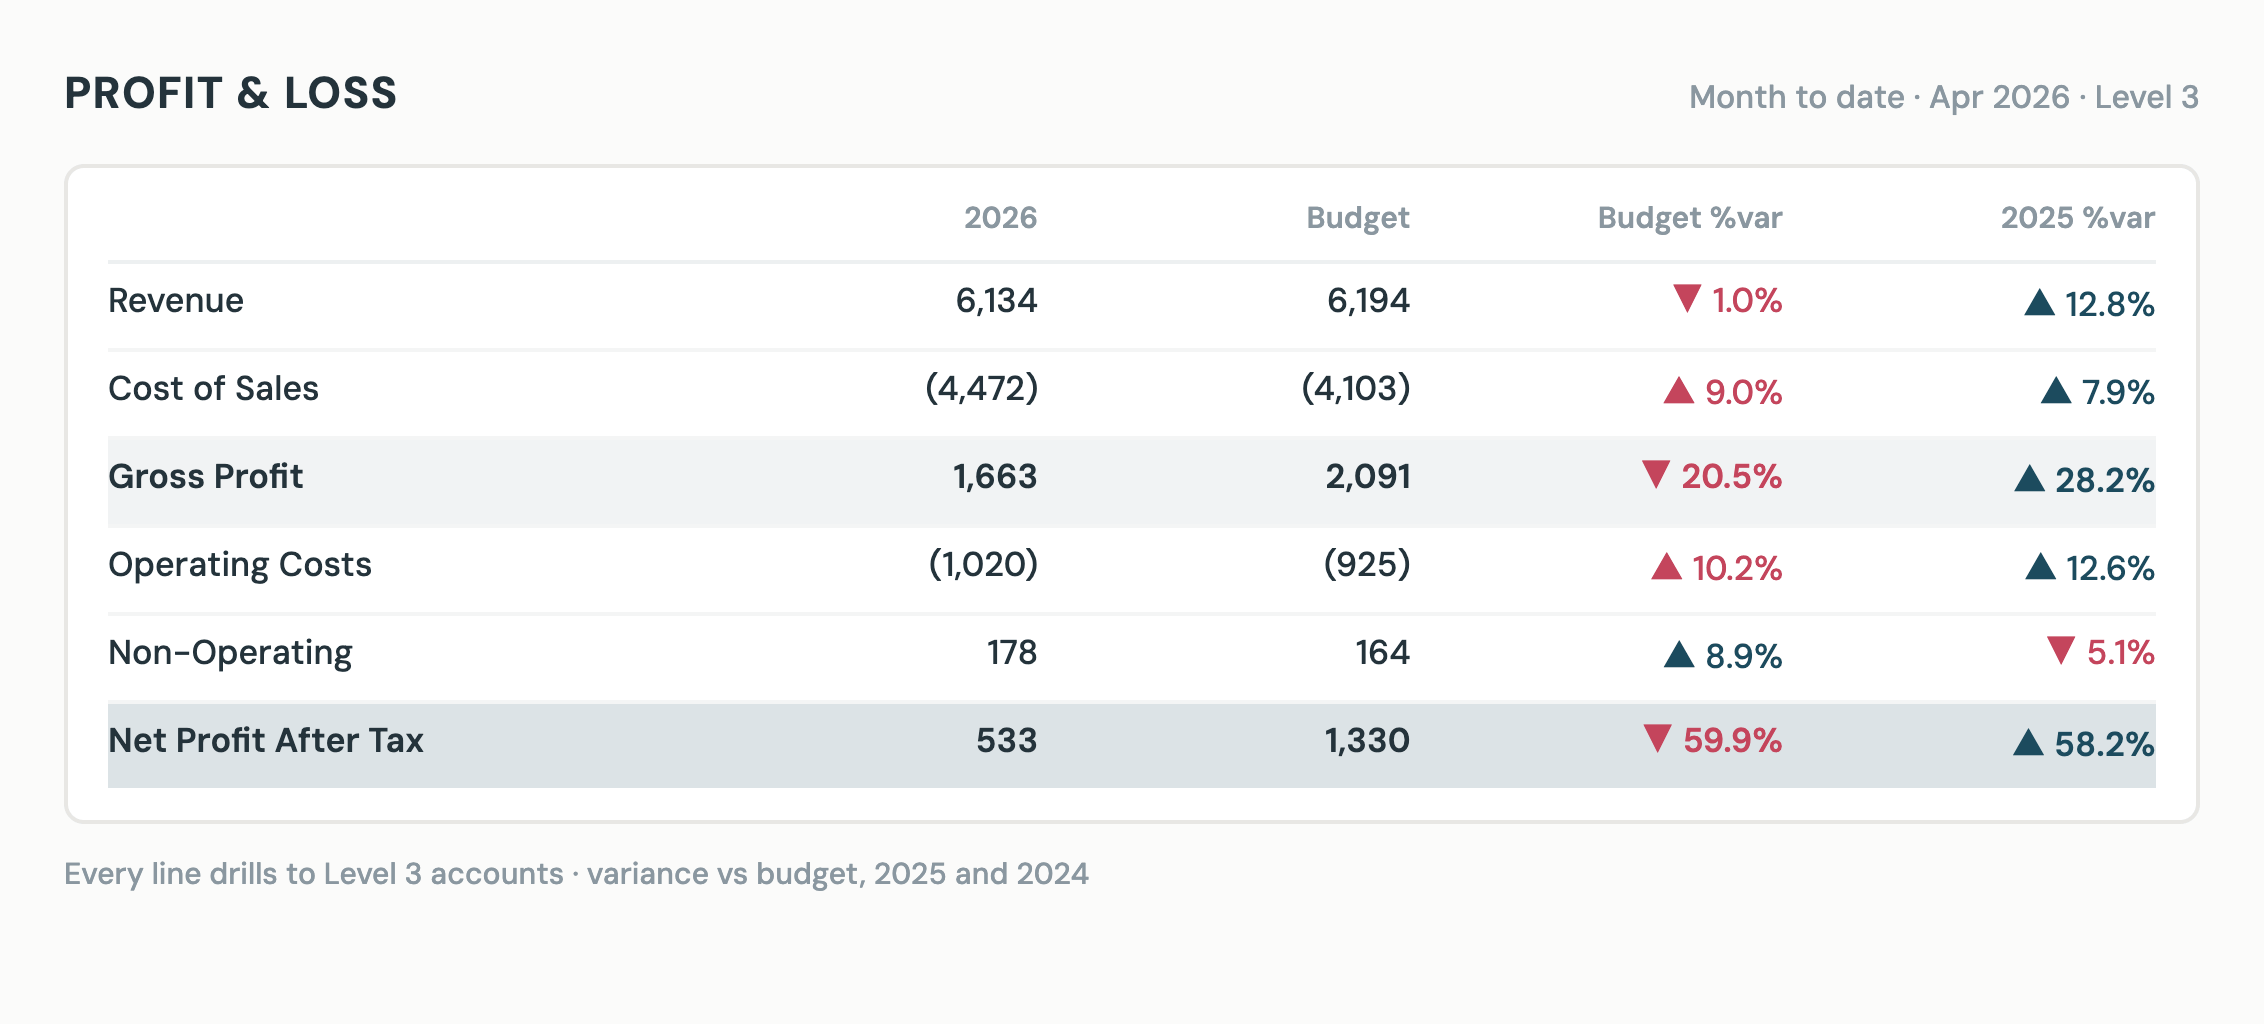
Finance
Investigate profit and loss against budget and prior years, with the detail to understand what is driving each variance.
Explore this dashboard on Tableau Public (opens in a new tab)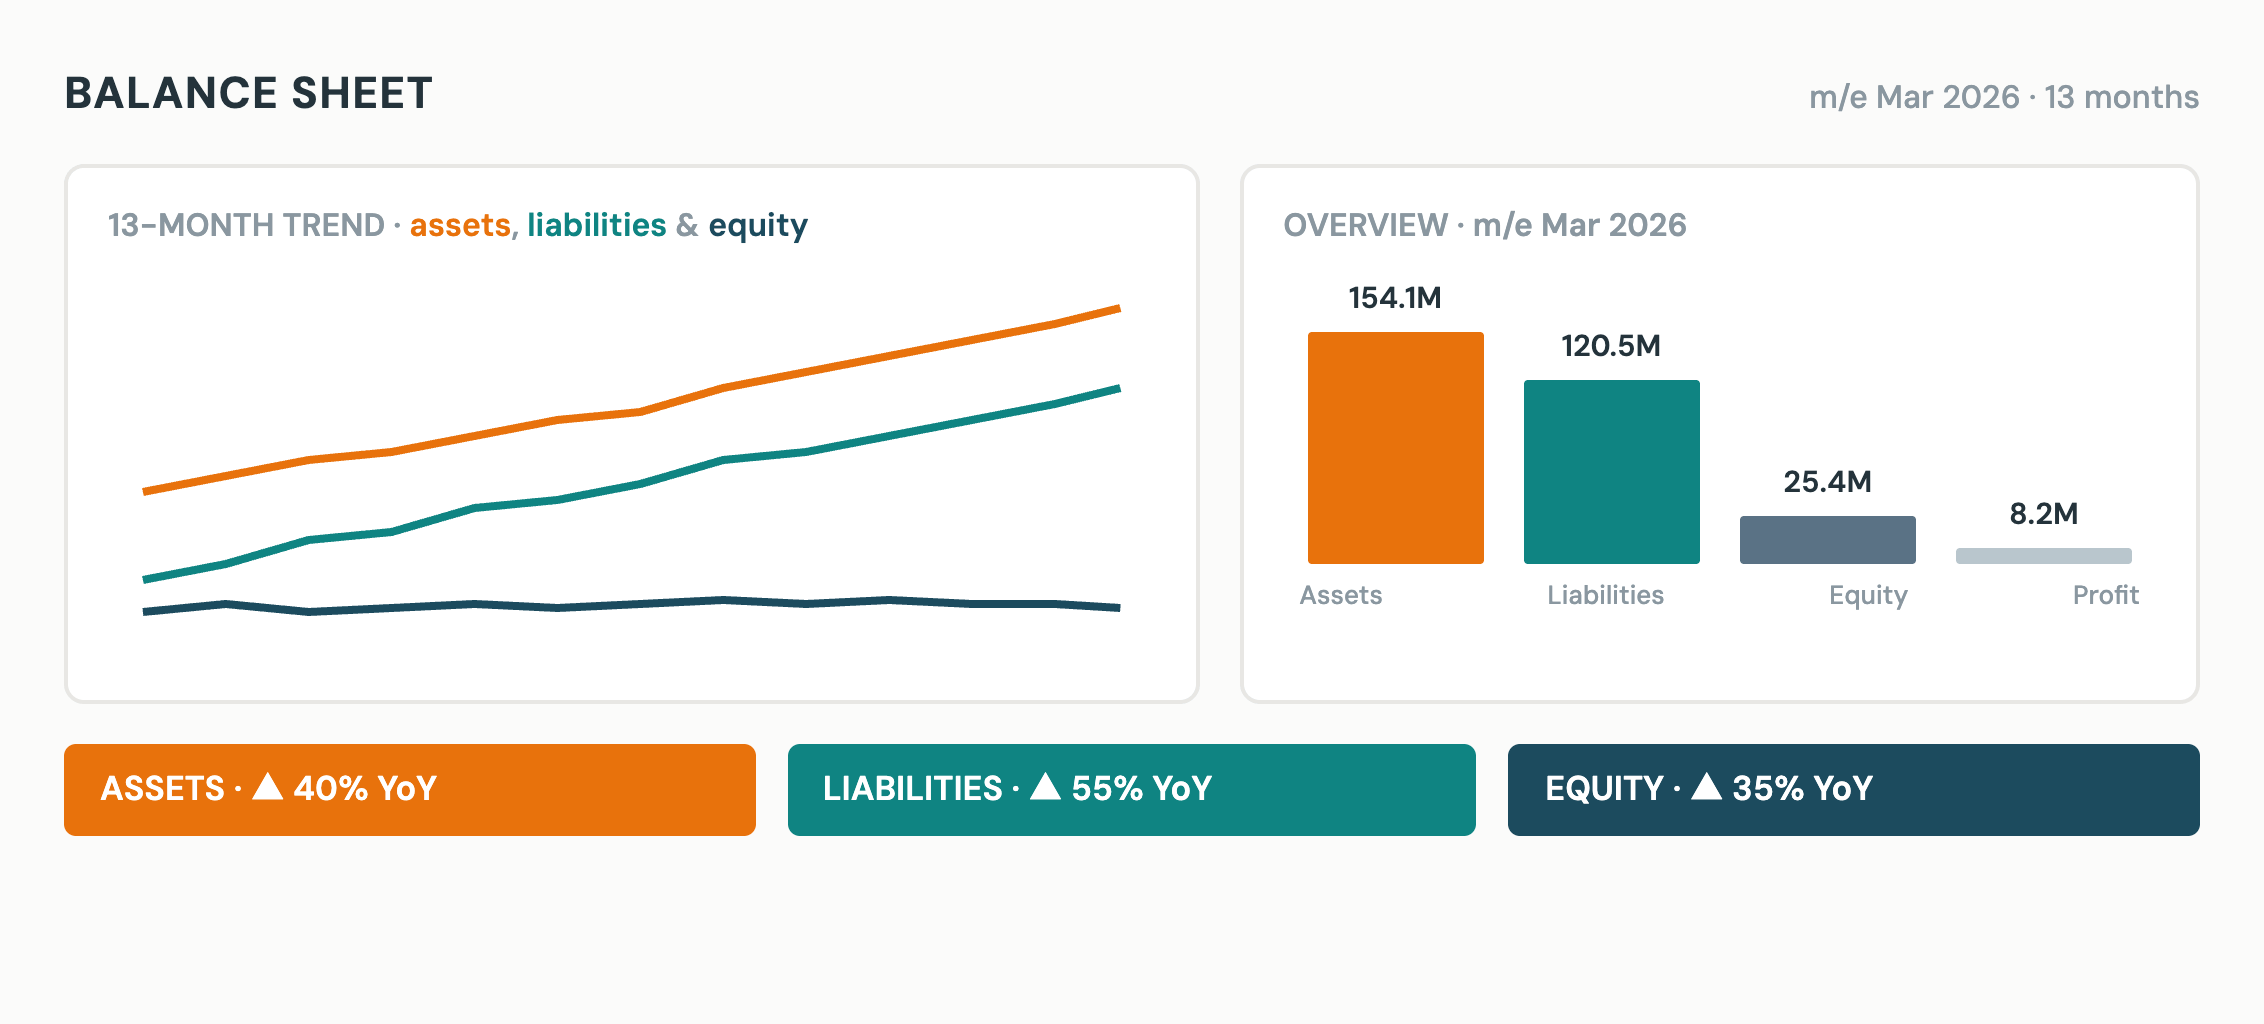
Finance
Follow assets, liabilities and equity over time. Review each balance and see how it has changed from last year.
Explore this dashboard on Tableau Public (opens in a new tab)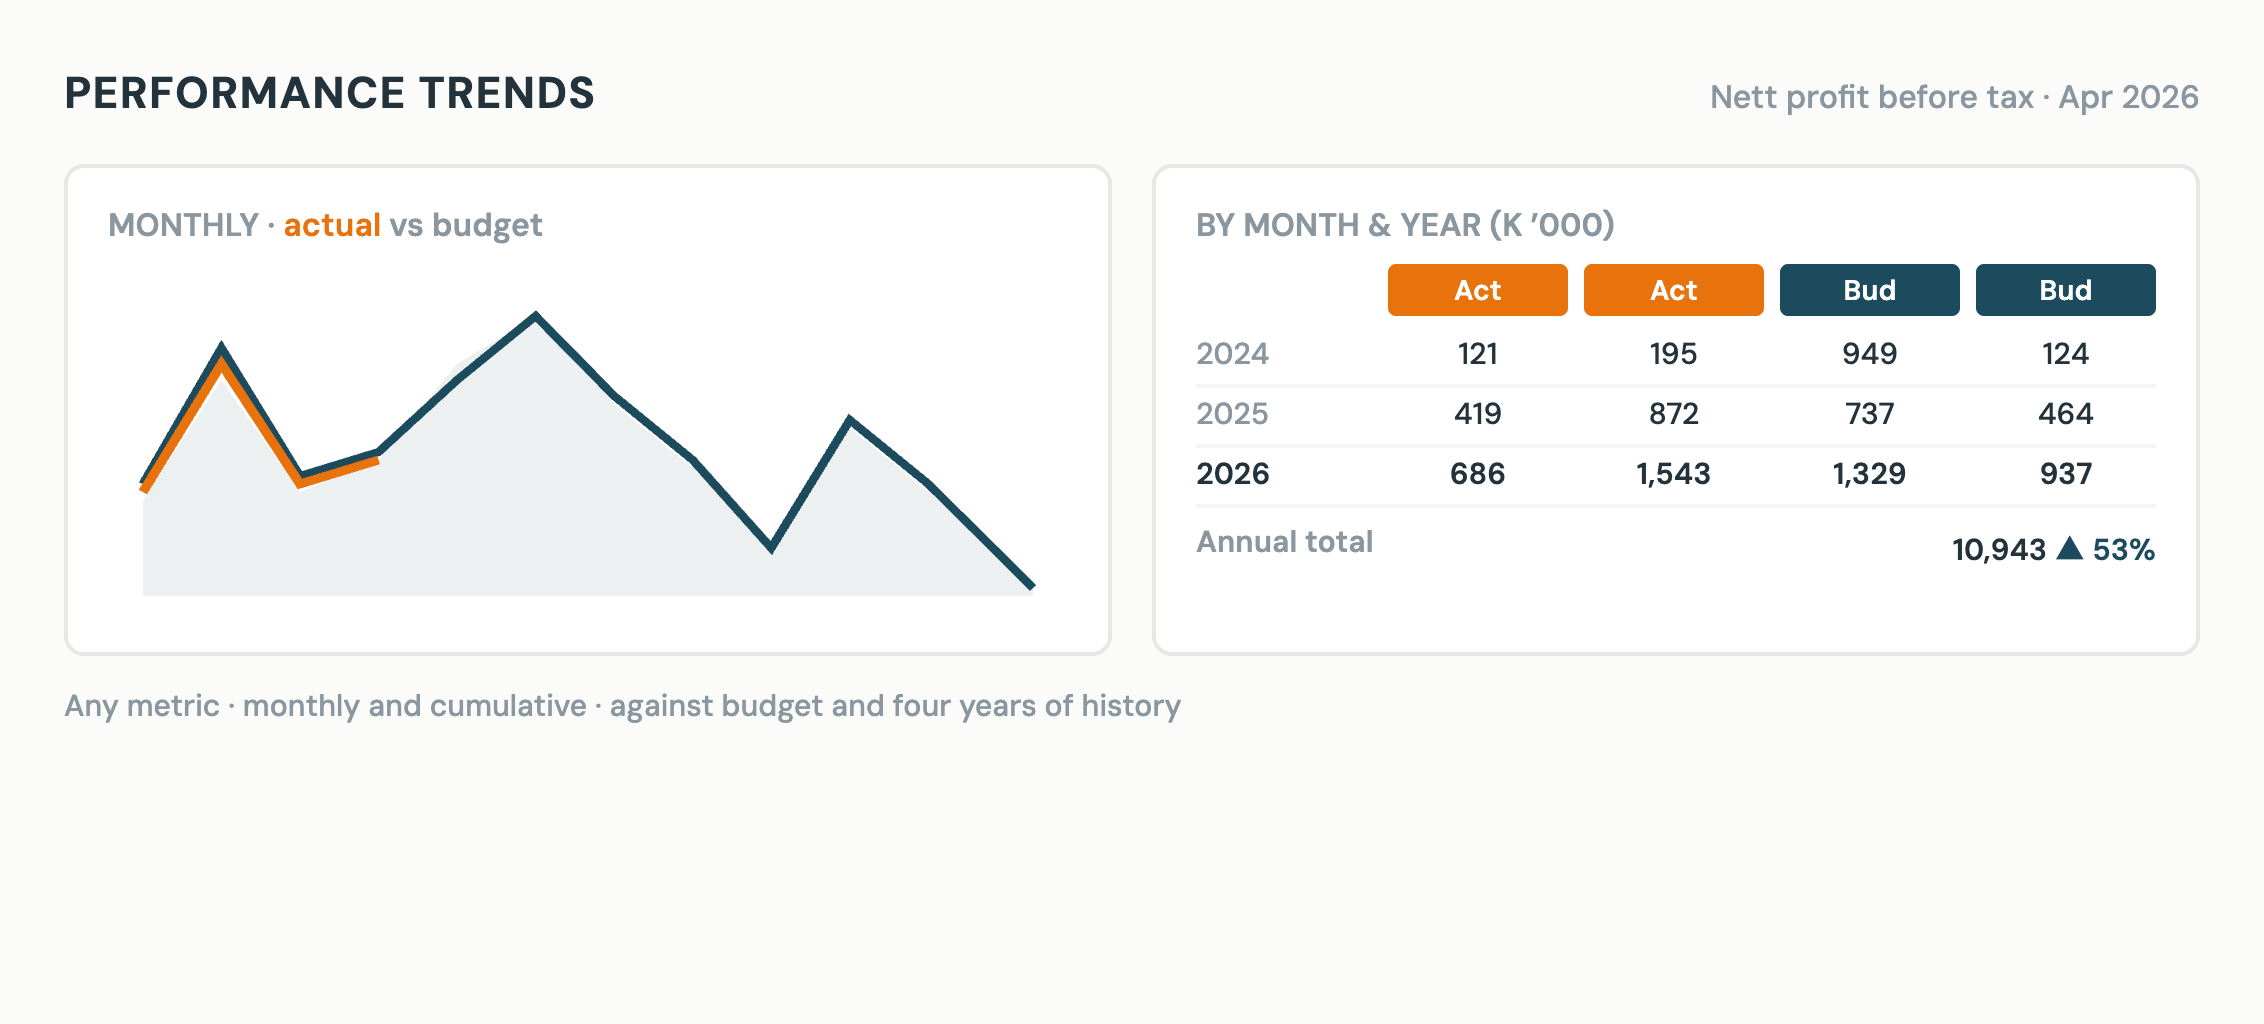
Finance
Examine costs and margins through monthly and cumulative trends, with budget comparisons and historical context.
Explore this dashboard on Tableau Public (opens in a new tab)Built around your business
A useful report starts with a clear question, trusted data and a shared understanding of what the numbers mean. We work with your people to bring those together.
Let’s talk